bling.github.io

This blog has relocated to bling.github.io.
Showing posts with label Software Tools. Show all posts

Sunday, February 10, 2013

Love Affair with Vim

It wasn't too long ago when I was a full-time C# developer and my environment was Visual Studio eight hours a day.  Then, I became a web developer over night cold turkey writing Javascript and CSS.  It's one of the benefits of working for a consulting company.

You might think what does that have to do with the title of this post?  Well, originally my plan was to write a blog post contrasting on the differences between Javascript and C#, as well as the development environments and deployment platforms.  But really, what I really wanted to write about was Vim.

Moving from Visual Studio to Vim was a progression through different editors and environments.  The first thing I used to write Javascript was Webstorm.  Over time I realized that you didn't really need an IDE to write Javascript/CSS.  Then, I used Sublime Text for a little bit.  But ultimately, I settled on Vim, and stayed there.

My stubbornness turned out to be beneficial when I was learning Vim because the first month was absolutely painful.  I remapped all of my arrows keys to do nothing to force myself to use hjkl.  Eventually I got the hang of it, and now I definitely have the muscle memory that makes me much more productive when editing (and reading) text.

By default Vim is just a text editor.  But I work on a project, so like most lazy people I searched for prepackaged plugins and came across two popular distributions: spf13 and janus.  When I installed them, it was like someone took over Vim and made it change into a completely different beast.  I didn't know how to use it anymore.

I took a step back.  I forgot where I got this advice, but I think anyone using Vim needs to do this: start your own vimrc from scratch.

I took a look at all the settings that spf13 and janus changed.  I copied them to my vimrc one by one, and also :helping each setting so that I knew exactly what it changed.  I must say, Vim's documentation is some of the best and most comprehensive of any tool I've worked with.  It was incredibly helpful in my progression.

Then, I did the same thing for plugins.  And the nice thing was that most plugins followed the Vim pattern of having good documentation.  After installing fooplugin, I just :help fooplugin and I got all the information I needed to know about the plugin.

I became obsessed with optimizing my vimrc, and trying out different plugins on a daily basis.  And because I was very adamant with trying one plugin at a time, I got to know them very well.  I knew about how to turn certain settings on and off, how to configure their bindings, and more importantly, how it interacted with all of the other plugins I have already installed.  Over time my vimrc became a full blown distribution in its own right, highly customized to my personal work habits.

However, even though I recommend that anyone interested in taking their Vim skills to the next level should do this discovery that I have done, there are certainly classes of plugins that I deem to be must-have for any Vim user and I wanted to highlight them here.

Plugin Management

First things first you will need one plugin to rule them all!  Pathogen changed the way people install plugins by utilizing git submodules.  This has the pros and cons of git submodules, i.e. they track a specific version of the external git repository, so if plugin authors decide to rewrite everything new users trying out your distribution will not be in for a nasty surprise.

However, this rarely happens and usually you just want the latest version.  Vundle takes the management one step further and will automatically grab source code from Github for you (as well as automatically updating everything to the latest version).

The last one and least known is neobundle, which enhances Vundle even further and allows you to specify installation steps like compiling something.

Fuzzy File Searching

This was the major game changer for me and changed the way I worked.  Naturally, proper Vim technique forces your hands to be on the home row, which makes reaching for the mouse (or even the arrow keys) to be inefficient.  Therefore, the fastest way to open a file is usually to type its name.

CommandT (written in Ruby) is noticeably much faster than CtrlP (pure VimScript), but CtrlP has a lot more features.  There's also FuzzyFinder, which I have not tried.

Autocomplete and Snippets

There are various contenders here.  Generally, you'll find that people fall into two camps.


Snipmate is an older implementation of snippets which is getting replaced with UltiSnips.  Supertab gives you an easy way to trigger omnicompletion with (you guessed it) tab, and AutoComplPop is for automatically showing the popup as you type.

Neocomplcache is a very powerful completion plugin.  It runs a little slower than SuperTab because it does a lot more, but I find the performance acceptable so that's what I'm using.  And I choose neosnippet over the others simply because it's by the same author and thus has better integration (e.g. available snippets will appear in the list).

And of course, a good collection of snippets like honza's collection.

And that's it!

What?!  No file browser?  No buffer manager?  Yes, I have all of those installed as well.  In fact, I have over 50 plugins installed in total.  But in my opinion, they are not killer features.  I can live without them.  But if I didn't have fuzzy searching or completion/snippets, I would feel a little too naked.

Out of the box Vim has some interesting defaults, mainly for backwards compatibility with Vi, but I think it's safe to say that anyone who uses Vim seriously will have a custom vimrc.  If you're just starting out and don't know what to change, sensible is a good set of defaults.

Vim has changed my work habits dramatically.  I think and dream Vim.  I install Vim plugins in my browsers.  And every day, she still teaches me new tricks.  It's quite exhilarating!

If you've read until this point you might be interested in the full set of plugins that I'm using.  If so, head over to my project page!

Sunday, July 29, 2012

SnoopShell: Evolution

It’s been a while since I last announced SnoopShell, where I took some PowerShell and injected that into Snoop.  Well, I didn’t stop there!  I decided to continue working on it and adding more useful features.

Well, a bunch of things have changed.  For one, it’s no longer targeted at .NET 4 and PS v3 anymore (and you’ll soon know why).  Second, there’s a bunch of new features!

Automatic Profile Loading

Upon startup, the shell will look for a couple well known locations and automatically dot-source them to load them into the current session.  This works the same as the standard $profile.  The filename needs to be SnoopProfile.ps1, and the search paths are %USERPROFILE%, the WindowsPowerShell, and the Scripts folder deployed with Snoop.exe.

This is incredibly useful since you can write your own custom functions and scripts and have them available to you all the time.  As an added bonus, because of the dynamic nature of PowerShell, you can make modifications to the SnoopProfile.ps1, save, and then invoke a “. $profile” to reload the profile and update the session with your changes (all without restarting the application).

That’s awesome sauce indeed ;-)

PowerShell Provider

This was more of a for-fun thing at first just to see if I could do it.  Writing a PS provider is not fun at all, since it’s not very well documented and I actually needed some help from ILSpy to figure out how things really worked.  Nonetheless, it’s got some basic functionality that is helpful to navigate around.

image

Yep, the selected grid actually has a path, like how you would navigate the file system.  Let’s see what happens with a cd.

image

Cool, you can cd into the child “directory”, and it’ll automatically select the item in the tree view as well.  What if you’re lazy and don’t want to type?

image

Wildcards are supported.  And because the visual tree doesn’t exactly require unique names, I needed to trick it by adding a number after each duplicate item.  So the above matches the third Rectangle child of the Grid.

Code Injection

One of the cool things about Javascript is that it’s so darn easy to test.  You make a change, save, reload, and you’ll immediately see if something worked or not.  This feedback loop is so fast it changes how you work and formulate ideas.

In the static world, we don’t really have this luxury, and especially not when you’re working on a large project, which at work, takes just under a minute for a full rebuild.  And this is on a monster machine.  Because of this, we had to employ tricks and workarounds to speed things up, like messing with build configurations and build output paths to minimize duplicate work.  Despite that, it’s still a pain to wait for the application to start and all that jazz.

What if we could do the super fast feedback loop development, in a static world?  Well, now you can!

It starts with a simple function:

function replace-command([string]$msg = 'hello world') {
$action = { [system.windows.messagebox]::show($msg) }.GetNewClosure()
$cmd = new-object galasoft.mvvmlight.command.relaycommand([system.action]$action)
$selected.target.command = $cmd
}

The above function will replace anything that has a Command property on the target, like a Button or MenuItem, with a MessageBox showing a message.  For the curious, GetNewClosure is needed so that $msg is available within the inner script block.  Unlike C#, closures are not automatic.

Since PowerShell is dynamic, if you need to make a change, simply save the script, reload it with a dot-source, which will overwrite the existing function, and then set the target’s Command property again.  Awesome!

The only annoyance is converting PowerShell code back into C# code once you’re done.

Evolution

If you made it this far you didn’t forget about my comment about untargeting .NET 4 and PS v3.  Well, changes have been merged into the main branch!  Soon the masses will be able to experiment with supercharging their applications with PowerShell!

I’ll likely continue working on my fork as there’s still more goodies I’d like to add.  Stay tuned!

Sunday, July 1, 2012

SnoopShell: The marriage of Snoop WPF and PowerShell

I was given the opportunity to review a couple chapters of the excellent book PowerShell for Developers, written by my colleague Doug Finke.  One of the concepts in the book was embedding a PowerShell console into your application.  This idea is ingenious and we added this feature to our client’s software, and so far it has increased our productivity and opened the doors to many possibilities.

So what’s so cool about embedding a shell into your application?  Well, for starters, one of the immediate advantages is that it gives you the opportunity to test your application at run time.  If you are implementing the MVVM pattern then basically anything you can see in the UI is bound to some property in your view model.  What if you could expose an instance of your view model to the PowerShell console?  Yes, you would be able to interact with it directly, change values, and property change notification will kick in and update the UI.

The possibilities start to open up from there.  You can start scripting out common tasks – write once, run many times.  Or you can write a full fledge test suite as a script, give it to a QA tester, and have them run through it as a special kind of integration testing, one that happens with live, real data.  Or how about being able to modify code, at runtime, to try out an implementation without need to recompile or restart the application?  Sounds pretty awesome to me!

With this, I started thinking why don’t I try and add this to Snoop?  It’s a staple tool for any WPF developer, and adding scripting capabilities to Snoop will make it even more useful.

So, I sat down for a weekend and took a shot at it.  And with that, SnoopShell was born!

My fork of Snoop can be found here: https://github.com/bling/snoopwpf

It’s still in super-duper alpha, so features/ideas are still getting formulated, but here’s a glimpse of what it can do now.

The $root variable points to the root of the tree.  As you can see, Snoop represents this as a ApplicationTreeItem, which has a bunch of properties, the important ones being IsSelected and IsExpanded.

image

Let’s try interacting with the object by setting the IsExpanded to true.

image

So far so good.  Now let’s find my username using Ctrl+Shift.  The $selected variable is automatically synchronized with the selected item in the tree.

image

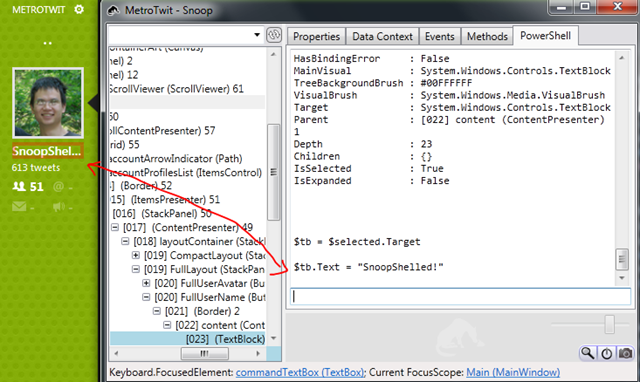
Let’s do some black magic and change my name.

image

Finally, let’s find every ListBox in the application.  Find-Item is used to recursively find everything in the visual tree which is a ListBox.

image

And from here, it’s as simple as grabbing the DataContext of any control to get access to the view model.

By the way, this is targeting PowerShell V3, so you will need to have the RC installed.

Try it out and let me know what you think!

Thursday, June 23, 2011

Tools I Use To Do What I Do

It’s been a while since I last blogged, but I want to get back into it….I just haven’t thought about what I wanna blog about yet.  I’m thinking of doing some sort of multi-part series on a topic but haven’t decided on what yet.  Nonetheless, just to get the ball rolling again here’s a quick blog post on some of the tools I use to do my every day job that’s in addition to your typical .NET developer tool chain.

General

StrokeIt:  Funny name aside, on any clean install of Windows this is the first thing I install.  I load up IE and I download this, followed by Chrome/Firefox.  It is a mouse gesture program that affects all of Windows.  By holding down the right mouse button, and making gestures you can do common tasks like minimize (drag SW), maximize (drag NE), close (draw a C), and others.  It’s much faster than clicking the minimize/maximize buttons.  For web browsing, creating and close tabs are drag SE and drag NW respectively.  Back is W.  Forward is E.  Working this way is faster than any keyboard shortcut.

Console2:  It’s not a necessity, but it’s nice to be able to use a console with a better looking font.  You can easily customize to run another shell, and in my case I have Powershell as the shell.

VirtuaWin:  Ironically I don’t use any virtual desktops, but this app creates a nice middle click on any window that lets you mark it as ‘always on top’.

Vim:  It was an awful, painful 2 weeks to learn this thing but I’m sure glad I did.

Development/Visual Studio

Resharper:  This one doesn’t need much mentioning as anyone serious about programming in .NET has either heard of it, use it, or use one of its competitors like CodeRush.

AllMargins:  This hidden gem is an awesome extension has brings a bunch of very useful features to the editor.  It brings structural highlighting, highlighting matching words under caret, and RockScroll inspired scroll bar, and it does it all with little to no cost in performance.

Productivity Power Tools:  There’s only 2 that I use here: document tabs, and moving lines.  All the rest are either eye candy, negligible enhancements, or just plain too slow to be any use in large solutions (solution navigator I’m looking at you!!).

XAML Intellisense Presenter:  This is a must-have for anyone who works with XAML in VS regularly.  Resharper 6 may soon make this obsolete, however…

ILSpy/dotPeek:  Decompilers.  ‘nuff said.

Snoop:  Staple tool for WPF developers to inspect the visual/logical tree.  There’s also WPF Inspector which has a much nicer UI, but unfortunately doesn’t perform as fast.

Profiling

ANTS/dotTrace/YourKit/etc:  I’ve used many performance/memory profilers, and those 3 are the ones I like the most.  Unfortunately, they all do things the others don’t, and all these things are very useful, so you still end up needing to use all of them to fix the particular problem you’re working on.

WinDbg: It isn’t every day I use this, but I’m sure glad to know that such a thing exists and the amount of power it gives me.

Scripting

PowerGUI:  Best tool I found for editing PowerShell.  The intellisense is great and has all the things you were expect when debugging through scripts.

Miscellaneous

BareTail:  Amazing program which watches log files in real time and can highlight rows based on a search pattern.

PowerShell/Cygwin/MSYS:  I used to be a Cygwin/MSYS user because back in the day I liked to install a different Linux distribution every week so I learned some basic Bash commands and that carried over to Windows.  Since PowerShell now exists, we have a real shell in Windows, so I’ve switched over to learn it, since as a Windows developer it’s more applicable to the kind of work I do.


And there’s more but that’s enough for now!

Friday, May 20, 2011

Taking a Quick Look at .NET Decompilers

Decompilers in the .NET space has changed a lot since the announcement from Red Gate that they were going to start charging for Reflector, which was the defacto most important/useful tool in any developer’s tool belt.

This blog post will be a quick overview to take a look at all the new contenders that have cropped up in the .NET space to see if any of them can dethrone Reflector as the decompiler of choice.  This is only taking a look at the tools as a stand alone product and excludes any IDE integration.

To start, let’s take a look at Reflector.

Red Gate Reflector (7.1.0.143)

Having been around for years, Reflector is a rock solid product that sets the standard for everything else.  It has a simple straight forward interface and has a large following with many 3rd party addins.  It has a search which lets you find types, and an analyzer which shows you incoming and outgoing calls for any method.  It also has the most options for decompiling, giving choices from C# to VB and even Delphi.

Another useful feature is being able change the framework from .NET to WPF to Silverlight.

As of this version it looks like they added tabs, but it for me it only used one at a time…perhaps a limitation of the trial version.

ILSpy (1.0.0.822)

This open source offering at this point looks the same as Reflector did just before Red Gate took over.  It has all the necessities, including search and analyze.  It can only view one thing at a time, and doesn’t have support for addins yet.  However, progress on this project is blazing fast and it’s only a matter of time before it reaches feature parity with the rest.

JustDecompile Beta (2011.1.516.2)

First impression was, damn, this is a nice pretty WPF app.  Onwards, it has a predefined assembly list of .NET2, 4, and Silverlight, which is nice.  What’s nicer is that you can save a predefined list for use later, a feature that’s absent from the others.  It has search by type, and search by symbol, however, the search is noticeably slower than everything else I tried.  Also, the actual decompiling is much slower than the rest as well.  Like ILSpy, it can only view one thing at a time.

Decompiling to C# and VB are supported, but no IL yet.

dotPeek EAP (1.0.0.1219)

I tried an EAP build and I was blown away.  I may be biased because I’m a Resharper user, but having almost all of the keyboard shortcuts I have in my muscle memory work in dotPeek was a welcome surprise.  The keyboard navigation makes dotPeek by far the best tool for navigating.  While the others have searches, they only do so at the type level.  With dotPeek (just like Resharper), you can search by type, current type, and even private members.  Inheritance searching like finding implementations, etc., all of that works.  Simply amazing.  Oh, and it also has full tab support.

It was also fast as well, which was a surprise considering it’s searching through the entire framework.  Searching all symbols for “m_” brought a list up in 2 seconds, and subsequent keystrokes narrowing it down occurred within half a second.

The downside?  No support for decompiling to IL, and lambdas aren’t fully supported yet.  I’m sure these will be done by the time it’s released.

Conclusion

I guess the most important thing I should be looking at is the actual decompiler, rather than the bells and whistles. If that’s what I looked at, this would be a pretty boring post because only Reflector is able to decompile everything out there.

JustDecompile failed to decompile some of the assemblies I threw it at it.  dotPeek at this stage doesn’t have good lambda support (if at all).  ILSpy decompiles very well at this point and I’d have to go out of my way to find an example where Reflector does it better than ILSpy.

In conclusion, I love dotPeek just because of the awesomeness that is Resharper keyboard shortcuts.  For everything else, ILSpy does the job.

I’m actually pretty thankful that Red Gate decided to charge money for Reflector, because that inspired so much competition and we already have 3 viable replacements, all of which are free -- something that wouldn’t have happened if Reflector remained free.

Sunday, April 17, 2011

Integrating DependencyPropertyWeaver Into Your Build

See the introduction here.

The MSBuild task as it stands currently by default will attempt to weave everything that it finds.  This is probably not optimal in most use cases, but any changes is a simple modification to the LINQ query in the code.  For now, it’s only available in source format since there are bound to be bugs here and there, and once those get ironed out it’ll be easier to release a “point something” release.

An example of how its used can be seen in the unit tests, in the project DependencyPropertyWeaver.Tests.Models.  If you open it up in your favorite text editor, you will see this crucial line:

<Target Name="AfterBuild">
    <Exec Command="C:\Windows\Microsoft.NET\Framework\v4.0.30319\MSBuild.exe postbuild.proj /p:Files=DependencyPropertyWeaver.Tests.Models.dll" WorkingDirectory="$(OutputPath)" />
  </Target>

And the contents of postbuild.proj is simply this:

<?xml version="1.0" encoding="utf-8"?>
<Project ToolsVersion="4.0" DefaultTargets="Weave" xmlns="http://schemas.microsoft.com/developer/msbuild/2003">
  <UsingTask TaskName="DependencyPropertyWeaver.DependencyPropertyWeaverTask"
             AssemblyFile="DependencyPropertyWeaver.dll" />
  <Target Name="Weave">
    <ItemGroup>
      <Input Include="$(Files)" />
    </ItemGroup>
    <DependencyPropertyWeaverTask Files="@(Input)" />
  </Target>
</Project>

The AfterBuild target is a special target with MSBuild, which, as the name implies, will run after the target has been built.  In this case, after the project is completed, it will invoke another MSBuild instance to perform the weaving.  Invoking a new MSBuild process is required because the <UsingTask> will load the assembly into the current AppDomain, and once loaded it cannot be unloaded.

If you don’t mind the unloading part, you can simply add the <UsingTask> directly into the project file and invoked the <DependencyPropertyWeaverTask> there, and avoid the hassle of having a separate file.

Currently, the DependencyPropertyWeaverTask supports the TypePatternMatch and AttributePatternMatch, which as the names imply will use regular expression filtering on type names or properties with the attribute you want to weave.  If these properties are null, they are ignored.

Next on the feature list is weaving attached properties ;-)

Sunday, September 13, 2009

Getting code coverage working on TeamCity 5 with something other than NUnit

I've been experimenting lately with TeamCity 5 EAP and so far it's been a pretty awesome experience. I was up and running within minutes and I was swarmed with beautiful graphs and statistics with specifics even per-test. Getting something like that up with CC.NET is not a trivial task.

Anywho, with TC5 code coverage is one of the cool new features added for .NET, but unfortunately only NUnit is supported. Not that that's a bad thing, but some people prefer to use other testing tools. Two notable contenders are xUnit.net and MbUnit.

I like the fact (pun intended) that xUnit.net makes it a point to prevent you from doing bad practices (like [ExpectedException]), and I like how MbUnit is so bleeding edge with useful features (like [Parallelizable] and a vast availability of assertions).


And with that I set up to figure out how to get TC working with Gallio, but the following should work with any test runner.

It certainly was a pain to set up because it took a lot of trial and error but eventually I figured it out.  I analyzed the build logs provided in each build report and noticed something interesting...specifically:


[13:51:23]: ##teamcity[importData type='dotNetCoverage' tool='ncover' file='C:\TeamCity5\buildAgent\temp\buildTmp\tmp1C93.tmp']
and

[13:51:30]: ##teamcity[buildStatisticValue key='CodeCoverageL' value='94.85067']
[13:51:30]: ##teamcity[buildStatisticValue key='CodeCoverageM' value='97.32143']
[13:51:30]: ##teamcity[buildStatisticValue key='CodeCoverageC' value='98.68421']
[13:51:30]: ##teamcity[buildStatisticValue key='CodeCoverageAbsLCovered' value='921.0']
[13:51:30]: ##teamcity[buildStatisticValue key='CodeCoverageAbsMCovered' value='218.0']
[13:51:30]: ##teamcity[buildStatisticValue key='CodeCoverageAbsCCovered' value='75.0']
[13:51:30]: ##teamcity[buildStatisticValue key='CodeCoverageAbsLTotal' value='971.0']
[13:51:30]: ##teamcity[buildStatisticValue key='CodeCoverageAbsMTotal' value='224.0']
[13:51:30]: ##teamcity[buildStatisticValue key='CodeCoverageAbsCTotal' value='76.0']

The first message happens after NCover.Console is done its thing.  After NCoverExplorer is done its thing, the statistics are published.  I set out to mimic this functionality with Gallio, but what's described here should work with any test runner.

1) Disable code coverage in TC.  We're doing it manually instead.
2) In your build script, run your unit tests with NCover and generate a coverage.xml report.
3) Run NCoverExplorer on coverage.xml and generate reports ncoverexplorer.xml and index.html.
4) Create a zip file of index.html and name it coverage.zip.
5) Configure coverage.zip to be an artifact in your TC configuration (this is to enable the tab).
6) Parse out ncoverexplorer.xml with XPath and output the statistics.

Certainly a lot of things to do just for the sake of pretty statistics reporting....but it was the weekend and I was bored.  With the help of MSBuildCommunityTasks, the zip file and XML parsing was made a lot easier.

After that, viola!  Code coverage + Gallio on TeamCity 5!!!

Unfortunately, NCoverExplorer's report only reports the # total of classes and nothing about unvisited or covered, so for those values I set to 0/0/0 (BTW, you need all values present for the statistics to show).  A task for next weekend!!!

(Edit: I suppose I could should also mention that you could technically avoid all the trouble above and hack it with this:
#if NUNIT
using TestFixtureAttribute = NUnit.Framework.TestFixtureAttribute;
using TestAttribute = NUnit.Framework.TestAttribute;
#endif
And it'll work just fine as well)